Abstract
This article explores the critical structure and resilience of supply chains within the defence and energy sectors. It begins with an overview of key supply chains supporting defence capabilities and identifies vulnerabilities that may pose strategic risks. In the context of the energy sector, the analysis covers the characteristics of energy-related supply chains, including mining, material production, and production lead times. Regional capacity for mineral resources and technology manufacturing is assessed in relation to strategic energy needs. A methodology for managing disruption risks specific to military microgrids is presented, recognising their importance in defence infrastructure. Finally, the article examines the emerging global hydrogen economy, with a focus on production geography, renewable resource deployment, and international trade flows. The findings provide a foundation for improving resilience and security across critical supply chain networks that support national defence and energy objectives.
Introduction
The global shift toward sustainable energy represents a profound transformation driven by climate imperatives, technological innovation, and evolving societal expectations. While the civilian sector has made notable progress in renewable energy adoption, electrification, and decarbonisation, defence energy systems face distinct and complex challenges. Military operations demand energy solutions that guarantee mission-critical reliability, rapid deployment, and high resilience under extreme or contested conditions—requirements that often exceed the capabilities of current civilian green technologies. Many low-carbon alternatives lack the energy density, logistical flexibility, and robustness needed for defence platforms operating in remote or hostile environments. Furthermore, defence applications require rigorous validation and long-term reliability before new technologies can be fielded, leading to slower adoption rates.[1] [2]
In light of these constraints, independent energy systems have emerged as a promising approach to enhance energy resilience within defence operations. These systems, which include solar arrays, battery storage, and advanced control technologies, enable localised energy generation. They play a critical role in ensuring the continued operation of essential infrastructure during disruptions caused by natural disasters, cyber attacks, or armed conflict. Beyond resilience, such systems can also reduce long-term operational costs, improve energy efficiency and contribute to sustainability goals through the integration of renewable resources.[3] [4]
The implementation of independent energy systems brings significant benefits but also introduces critical challenges, particularly in terms of supply chain dependencies. Defence forces rely on complex and globally interconnected supply networks to obtain the specialised components and materials required for advanced energy technologies.[5] [6] These include rare earth elements, precision-manufactured parts, fuel supply chain, and high-performance storage and control systems.[7] [8] Such dependence exposes defence energy infrastructure to a range of risks, including geopolitical tensions, market volatility, logistical disruptions, and cyber threats.[9] In the absence of a secure and resilient supply chain, even the most advanced systems can fail to deliver during emergencies. Therefore, assessing supply chains in the context of sustainable energy is essential and warrants detailed investigation, as outlined below.
Overview of Supply Chains and Key Products in the Defence Sector
The foundation of complex global supply chains was laid in the 1970s, when industries such as apparel began outsourcing certain production stages to Asia. Over the decades, global supply chains have evolved into the dominant industrial model across a wide range of sectors, particularly within high-tech industries reliant on specialised skills and expertise.[10] As a result, supply chains have become the principal industrial framework in the defence sector, driven by the technological sophistication of contemporary military platforms.[11]
Global defence corporations, commonly referred to as ‘primes’ in Australia, are central to the defence procurement process. They manage and coordinate a diverse array of defence supply chains on behalf of governments under procurement contracts. Furthermore, small and medium-sized enterprises in Australia have developed significant capabilities and established their own supply chains within the defence industry.[12]
While the term ‘supply chain’ typically conjures an image of a straightforward flow of goods across borders—starting with raw materials, progressing through stages of production, and culminating in finished products delivered to consumers—it oversimplifies the intricate dynamics at play. Global supply chains are far more complex, involving three key and interdependent flows:[13]
- Material flows—the movement of commodities as they progress through various stages of production across multiple countries.
- Capital flows—the commercial relationships between firms within the supply chain, including investments and contractual agreements that govern their interactions.
- Knowledge flows—the transfer of intellectual property and expertise between firms, either shared directly or embedded within goods and services.
These interconnected flows forge relationships of interdependence among supply chain participants. Nations and firms do not merely exchange goods; they build long-term, institutionalised commercial relationships that integrate the various components of the system. While a final product may be labelled ‘made in’ a particular country or ‘made by’ a particular company, its production relies on a globally coordinated network, with numerous countries and firms playing crucial roles. Understanding the structure of these networks is vital for assessing and enhancing the security of supply for modern products. Moreover, supply chains should not be conceived as linear sequences of relationships. Instead, they are better characterised as complex webs, with multiple participants at each production stage and overlapping connections between them.[14]
Supply Chain Configuration Models
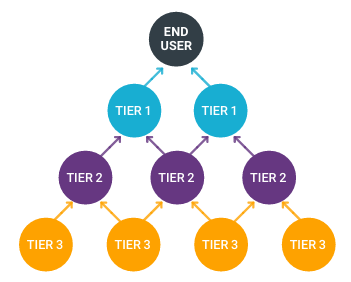
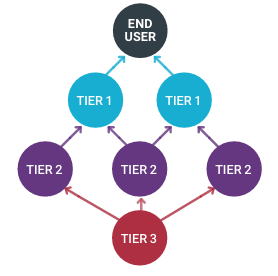
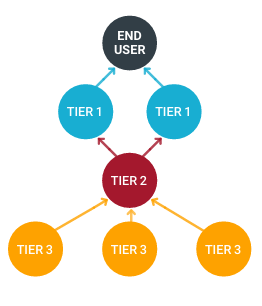
Supply chains can take various structural forms, each with distinct implications for resilience and vulnerability. Below are some examples of chain configuration models; the ‘critical’ nodes are highlighted in red.[15]
Branching supply chains (Figure 1) are considered highly robust, as downstream users source inputs from multiple suppliers, each with their own networks. This competitive structure minimises reliance on any single participant, thereby reducing the risk of disruption at critical points.
In contrast, diamond supply chains (Figure 2) feature diversified suppliers at the downstream level, but these suppliers ultimately rely on a single upstream source. While appearing resilient at first glance, this model creates a strategic vulnerability at the upstream node, where any failure can impact the entire chain.
Hourglass supply chains (Figure 3) involve numerous upstream suppliers and downstream users, but they converge around a single critical midstream entity. This centralisation makes the entire system dependent on the uninterrupted function of that midstream player.
Finally, linear supply chains (Figure 4) represent a more fragile structure in which each downstream user manages its own sequential chain of midstream and upstream suppliers, with each link acting as a critical node. This model is rare. It is typically associated with highly specialised products where tight control is essential, but it offers the least resilience to disruption.
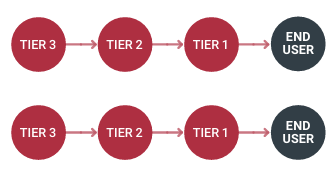
Criticality serves as the pivotal factor that governs the resilience of global supply chains. Supply chains containing critical nodes—such as those with a diamond or hourglass structure—are less adaptable to external disruptions. In contrast, supply chains that lack critical nodes, such as branching models, are inherently more flexible and capable of adjusting to shocks. Importantly, the existence of critical nodes is often hidden from those further along the chain. In hourglass or diamond-shaped supply chains, downstream users with multiple tier-1 suppliers may remain unaware of the critical nodes that exist further upstream. A clear example of this ‘hidden’ criticality can be seen in the global battery production supply chain, which exhibits an hourglass shape, with China controlling the production of vital midstream components (see Table 1). Despite having diverse suppliers at both the upstream (mining) and downstream (battery assembly) stages, both ends are heavily reliant on China for materials processing and refining. For instance, lithium mined in Australia and used in batteries assembled in Japan must undergo processing in China. This concentration gives China far greater leverage over the global battery market than its relatively small share of final product sales (around 20 per cent) would suggest. Understanding the entire global supply chain is crucial, as it reveals critical nodes that would otherwise remain obscured when viewed from either the upstream or downstream perspective alone.[16]
Defence supply chains present unique and more complex challenges when it comes to managing criticality. Compared to civilian supply chains, those in the defence sector typically feature a higher number of critical nodes due to several key factors:[17]
- High economic importance: Defence products are often essential for national security and operational effectiveness, with strict requirements that leave limited room for substitution with similar alternatives.
- Increased concentration: Defence supply chains tend to be more concentrated due to stringent design specifications and security compliance needs, which limits the number of firms capable of participating.
- Reliance on imports: Smaller nations often find it economically unfeasible to produce all the necessary defence capabilities locally, making them more reliant on imported goods and services.
- Intellectual property: Defence products frequently contain high levels of intellectual property, necessitating long-term relationships between manufacturers and customers for ongoing support and services post delivery.
- Geopolitical risks: The strategic nature of the defence sector exposes these supply chains to heightened risks of geopolitical interruptions, which can disrupt the flow of critical components.
- Longer supply chains: Modern defence platforms often require advanced technology, which results in supply chains that can extend over 10 or more tiers.
These factors make defence supply chains more intricate and prone to risk than those in most other sectors. Given the complexity, the multitude of potential risk points and the higher expectations for continuity, defence supply chains require much more focused attention on risk management. The approaches used in civilian sectors are insufficient, as the defence sector’s specific risks must be understood and mitigated through tailored strategies that go beyond standard commercial practices.
| Countries | Up stream | Mid stream | Down stream | ||
|---|---|---|---|---|---|
| Raw materials | Refining | Active materials | Cell manufacturing | Battery pack assembly | |
| Australia |
50% |
0% |
0% |
0% |
0% |
| Chile |
29% |
11% |
0% |
0% |
0% |
| China |
6% |
89% |
64% |
50% |
20% |
| Japan |
0% |
0% |
11% |
20% |
50% |
| Korea |
0% |
0% |
10% |
20% |
20% |
| USA |
1% |
0% |
0% |
8% |
9% |
| Others |
14% |
0% |
17% |
2% |
1% |
Assessing and Managing Supply Chain Risks in the Defence Sector
Mapping a supply chain’s framework is an essential initial step in pinpointing potential risks, particularly when identifying crucial nodes that could lead to disruptions. The next phase involves assessing the probability of these risks resulting in actual interruptions. Various factors can trigger such disruptions, which can be divided into two broad categories: traditional and strategic supply chain risks. Traditional supply chain risks have long been present and affect industries universally, as follows:[18]
- Economic disruptions: Sudden changes in market demand or rapid technological developments can lead to short-term shortages of essential components. A well-known example is the global semiconductor shortage,[19] which caused production stoppages in the automotive sector and contributed to a worldwide scarcity of vehicles.
- Infrastructure and transport disruptions: Delays in logistics networks, including customs procedures and transportation routes, can severely impact the movement of goods. Notable cases include the six-day blockage of the Suez Canal in 2021,[20] ongoing congestion at major US ports, and COVID-19 related delays at key Chinese shipping hubs.[21]
- Environmental and health-related hazards: Natural events such as wildfires, floods, droughts and pandemics can significantly disrupt routine business operations. The COVID-19 pandemic,[22] along with natural disasters in Taiwan and Japan—both major centres of semiconductor production—further intensified the global chip shortage.
- Social and political instability: Mass protests, civil unrest, and industrial action can disrupt supply chains, particularly in resource-based sectors. For example, civil unrest in Kazakhstan affected oil and uranium exports,[23] while strikes at Fremantle Ports in Western Australia threatened construction sector supply flows.
These types of risks are recurring and embedded within the fabric of the global economy. Businesses across all sectors typically address them through well-established measures such as inventory management, multi-sourcing, and supplier diversification. While these disruptions can be severe, they are not exclusive to the defence sector and are largely characterised as unpredictable events that companies must be ready to manage as they occur.
In contrast, strategic supply chain risks have become increasingly prominent in recent years, particularly within the defence industry. These risks stem from evolving geopolitical dynamics, which include the following:[24]
- Geopolitical intervention risks: These occur when governments intentionally disrupt supply chains for political or strategic purposes. Measures such as trade sanctions, export controls and embargoes fall into this category. For instance, China’s trade restrictions imposed amid diplomatic tensions with Australia, and the United States’ national security related bans on Chinese technology firms, exemplify such interventions.
- Geopolitical demand shocks: Supply chain demands can change rapidly in response to geopolitical developments. This may involve the exclusion of certain suppliers due to international conflict or a sudden increase in demand for military equipment during periods of heightened geopolitical tension.
- Security threats to intangible assets: These risks involve cyber attacks, theft of intellectual property, and breaches of classified or sensitive data. Rather than targeting physical goods, these threats compromise the exchange of knowledge, designs and proprietary information across the supply chain.
Strategic risks differ fundamentally from traditional operational risks in that they are deliberate, politically motivated, and often intended to compromise the stability and integrity of supply chains. Although such risks can affect any sector, they are particularly critical in defence-related industries, which are frequent targets of geopolitical interference. The increasing digitalisation of global supply networks and heightened international tensions have contributed to the growing prevalence of these threats.
To address these challenges, organisations operating within global industries typically adopt supply chain management approaches that fall along a continuum between efficiency and resilience:[25]
- Efficiency-focused models aim to reduce costs and optimise speed to maintain a competitive advantage. Common strategies include offshoring and just-in-time production, which minimise inventory and streamline operations.
- Resilience-oriented models prioritise adaptability and risk mitigation, often accepting higher costs to safeguard against disruptions. An example is the just-in-case approach, which involves maintaining surplus inventory to cushion against unexpected interruptions.
These models are not mutually exclusive; rather, businesses select their position on this spectrum based on the nature, frequency and potential impact of risks in their operating environment. In relatively stable industries, where disruptions are infrequent or low impact, efficiency strategies tend to dominate. In contrast, sectors exposed to significant uncertainty or strategic threats increasingly favour resilience-based approaches.
To enhance resilience, firms may adopt a range of risk mitigation measures, each with distinct trade-offs in terms of cost, complexity and effectiveness:[26]
- Strategic stockpiling involves holding buffer inventories to bridge temporary supply gaps. This approach is suitable for products with stable demand and longer shelf life, but less effective for perishable or rapidly obsolete items.
- Supplier diversification reduces reliance on single sources by engaging multiple suppliers, ideally across different geographic regions. This lessens exposure to disruptions linked to national-level political or logistical issues.
- Friend-shoring refers to sourcing critical inputs from trusted nations or corporate partners with shared strategic interests. While not always feasible for replacing key supply chain nodes, it can significantly enhance security and reliability where substitution is difficult.
- Onshoring or in-house production involves relocating or internalising the manufacture of essential components to improve control and reduce external dependencies. Although often resource intensive, this strategy offers the highest level of oversight and security for critical supply chain elements.
While these strategies can improve resilience, they come at a considerable cost. Businesses typically implement them when the risks justify the expenses. Even in the defence sector, where resilience is crucial, these strategies are applied selectively to the most vulnerable areas. Therefore, effective supply chain risk management requires a tailored approach, where managers assess the criticality of risk points and implement proportionate mitigation measures to maintain business continuity while avoiding unnecessary costs.
Key Strategies for Defence Supply Chain Security
The current global geopolitical situation has led to a heightened risk of strategic disruptions to supply chains, a concern that was not as pronounced in the past. Although it is unclear when traditional supply chain disruptions will return to normal levels, there are strong indications that the increased level of strategic risks is likely to be a permanent feature of the defence sector for the foreseeable future. The 2020 Defence Strategic Update[27] highlighted the critical need for Australia’s defence sector to modernise its supply chain security strategies. However, no single approach can be universally applied to defence supply chain security, as these supply chains vary widely. They differ in structure, reliance on key components, and exposure to both conventional and emerging risks. There are various methods available to manage these challenges, ranging from cost-effective, scalable solutions such as diversification and stockpiling, to more resource-intensive strategies like developing trusted or sovereign capabilities. Given the limited resources available to strengthen supply chain security, the focus should be on effective risk management. This involves not only identifying and evaluating risks but also taking targeted, proportionate actions where necessary. Securing supply chains is a collective responsibility that involves all parts of the defence sector. While the federal government, particularly the Department of Defence, plays a vital role in purchasing, managing and using defence materials, the defence industry also plays a crucial part due to its deep expertise in managing supply chains. This responsibility extends beyond just the primary contractors to include other important players throughout the upper tiers of the supply chain. Security initiatives must involve the entire defence industry ecosystem, working collaboratively to create more resilient and reliable global supply chains. To guide these efforts, a set of core ‘framework principles’ are proposed to assist in shaping defence supply chain security initiatives between the government and defence industry. As shown in Figure 5, four key principles—concerning information sharing, risk assignment, appropriate interventions, and government–industry collaboration—are fundamental to effective supply chain security practices. While the application of these principles will vary across different defence supply chains, they provide a strong framework for future policy development.[28]
[29]
| Informational resources |
|
|---|---|
| Assigning risk |
|
| Calibrating interventions |
|
| Government industry collaboration |
|
The first principle focuses on enhancing information resources. At present, information about defence supply chains is fragmented and inconsistent, lacking the detail necessary to fully identify vulnerabilities. Mapping the supply chain is the first step in identifying critical nodes. Given the complexity of defence supply chains, this process must go beyond traditional methods and utilise more efficient automated tools, which can provide a clearer, more detailed picture than earlier manual approaches. It is also important to assess both current operational needs and future flexibility. Defence supply chains must meet present requirements while being adaptable to future demands. The mapping process should therefore account for both current and potential future needs. Supply chain considerations should be incorporated early in the project life cycle, as decisions made during the early acquisition stages often determine which suppliers are chosen, influencing the entire supply chain structure.[30]
The second principle focuses on assigning risk to the critical nodes identified during mapping. While mapping helps identify where critical nodes are located, it does not assess the risks associated with these points. Further risk assessments are necessary to determine the likelihood of disruptions and understand the potential impacts on supply chain resilience. These assessments will require human judgement and cannot be fully automated. Risk assessments should aim to:[31]
- identify nodes facing higher-than-average traditional risks, such as components with specific technical requirements that are difficult to substitute or those that compete with civilian markets
- assess the possibility and implications of strategic risks. Although strategic risks have not yet affected defence supply chains directly, changes in the global political landscape make it likely that such risks may arise in the future. These assessments should factor in the potential for political or geopolitical events to disrupt supply chains
- forecast risks over the entire project life cycle. Given the long-term nature of many defence capabilities, risk assessments should not be static but should predict emerging risks throughout the life of a project, not just in the present.
The third principle involves matching supply chain interventions to the level of risk identified. Various resilience-building interventions are available, but their costs vary, so it is essential to tailor the response to the level of risk. For moderate risks, low-cost measures such as stockpiling or diversification should be prioritised, while more significant risks may require higher-cost interventions like building trusted capability networks or establishing sovereign capabilities. Key interventions include:[32]
- stockpiling and diversification, which are often the most cost-effective methods; these should be used to mitigate short-term risks or reduce dependence on a narrow set of suppliers
- building trusted capability networks, which can provide a balanced approach for securing critical components without the need for complete self-reliance. Working with trusted partners helps spread resources across multiple risks
- developing sovereign capabilities, which offer the highest level of security but come with higher initial costs and a longer time frame for implementation. Sovereign capabilities should only be pursued after thoroughly evaluating the associated risks, particularly those related to strategic factors.
The fourth principle stresses the importance of strong collaboration between the government and the defence industry. Supply chain resilience is a shared responsibility, with both parties playing essential roles. The government sets policy and handles procurement, but the defence industry is key in identifying risks and executing resilience strategies. Effective collaboration is necessary for success, and this involves:[33]
- ensuring both the government and defence industry have aligned definitions of critical nodes and agree on the levels of information needed for meaningful collaboration
- developing robust governance and information-sharing frameworks, particularly for the management of commercial and security-sensitive data, to support cooperation across both sectors. Initiatives like the Office of Supply Chain Resilience provide a foundation for this kind of collaboration
- addressing supply chain security early in the procurement process. Many defence procurement decisions made early on in a project will have significant consequences for supply chain security. Supply chain security must be integrated into the procurement process from the beginning, with clear contracts outlining the roles and responsibilities of both the government and the defence industry contractor.
In conclusion, strengthening defence supply chain security requires a coordinated, collective effort between the government and industry. By focusing on risk management, implementing tailored interventions and fostering strong collaboration, the defence sector can build supply chains that are resilient enough to handle both existing and emerging risks.
Defining Features of Supply Chains in the Energy Sector
Figure 6 highlights the integrated nature of energy and technology supply chains, each comprising distinct yet interconnected processes essential for delivering modern energy services and technologies to end users. The energy supply chain involves a sequence of operations—from energy generation and conversion to transportation and distribution—often incorporating cross-border trade. Meanwhile, the technology supply chain encompasses the full life cycle of technological products, beginning with the extraction of mineral resources, followed by material refinement and component fabrication, and culminating in the deployment, maintenance and eventual recycling or repurposing of equipment. These systems are mutually dependent: technological infrastructure is critical for producing and distributing energy, while energy is a fundamental input across all stages of technology development and deployment.[34]
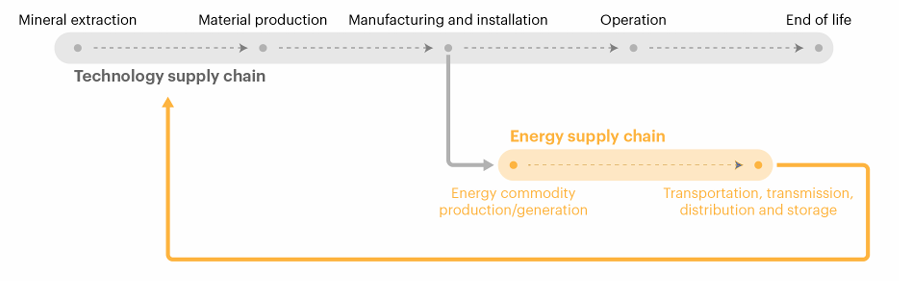
Source: International Energy Agency, Energy Technology Perspectives 2023 (IEA)[35]
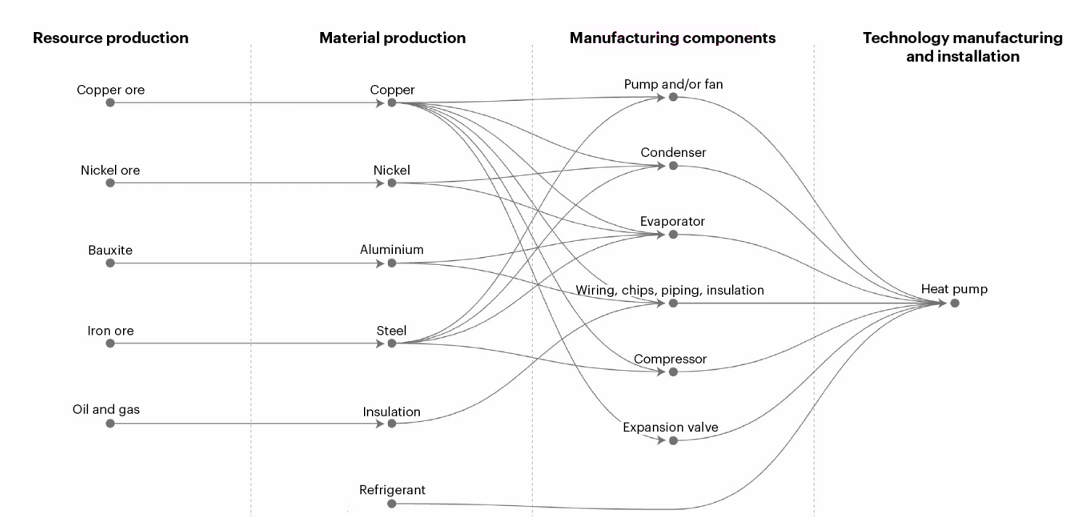
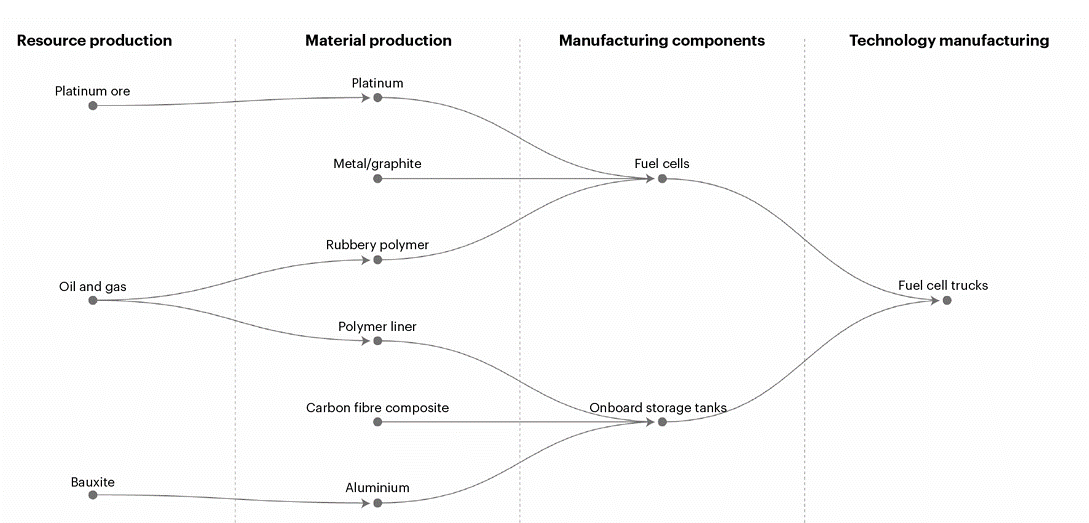
It is essential to understand that each category of equipment within the energy and technology sectors is supported by a distinct and complex supply chain, extending from the extraction of raw materials to the delivery of the final product. This is clearly depicted in Figure 7, Figure 8, Figure 9, Figure 10 and Figure 11, which outline the specific supply chains associated with various technologies, including low-emission electricity generation, low-emission hydrogen production, battery electric vehicles, heat pumps, and fuel cell trucks. Each of these technologies follows its own developmental pathway, involving tailored processes such as the extraction and refinement of critical minerals, the manufacture and assembly of specialised components, and the deployment and operational integration of the final equipment. Furthermore, these supply chains do not operate in isolation. They are often interlinked, with shared materials, technologies and services flowing across different sectors. This interconnection highlights the inherent complexity and mutual dependence that characterise today’s energy and technology systems.[36]
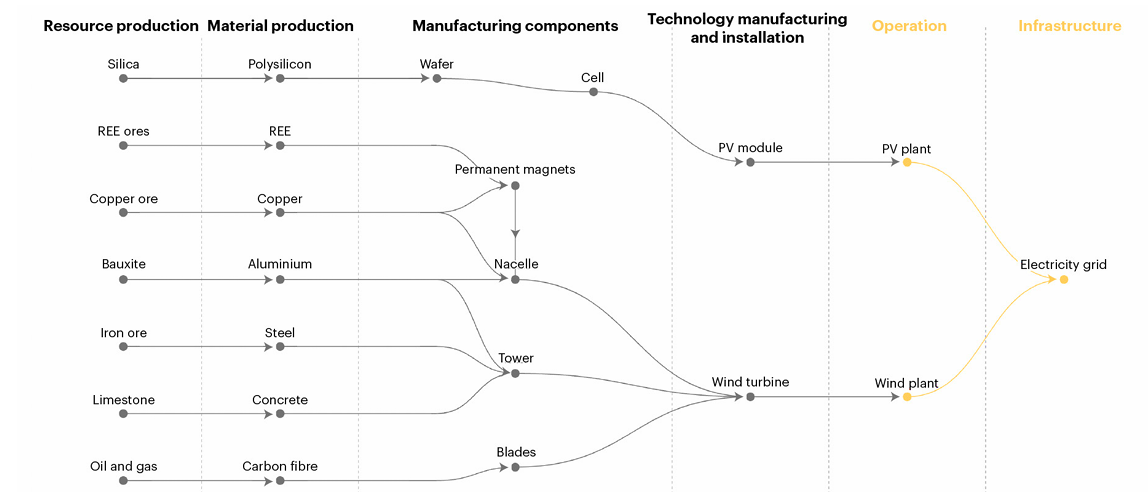
Source: International Energy Agency, Energy Technology Perspectives 2023 (IEA)[37]
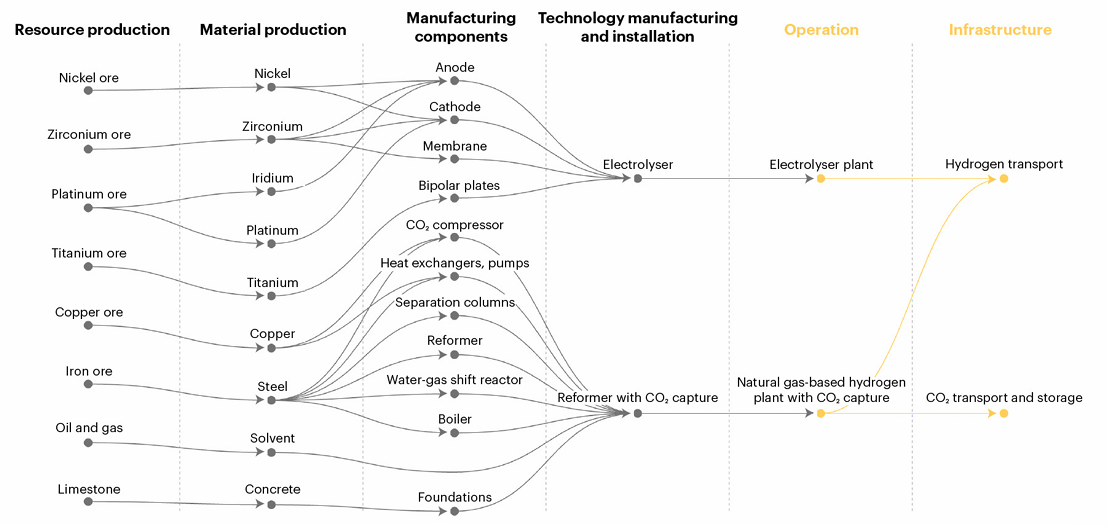
Source: International Energy Agency, Energy Technology Perspectives 2023 (IEA)[38]
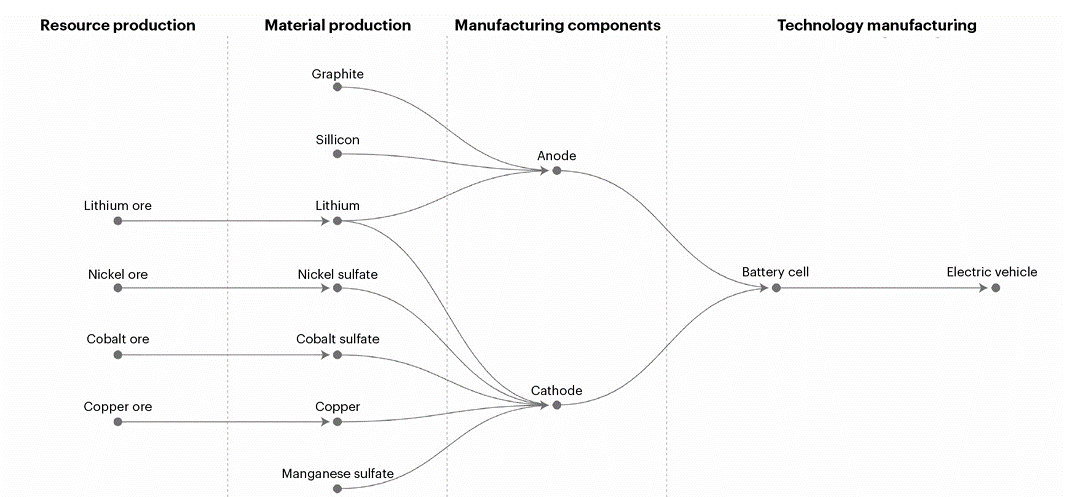
Source: International Energy Agency, Energy Technology Perspectives 2023 (IEA)[39]
Source: International Energy Agency, Energy Technology Perspectives 2023 (IEA)[40]
Source: International Energy Agency, Energy Technology Perspectives 2023 (IEA)[41]
Geographic Distribution of Mineral Resources, Technology Manufacturing Capacity, and Fuel Supply Chains
Here we examine the supply chains of various components in the energy sector, including minerals, manufacturing and fuel.[42]
Mining and Material Production
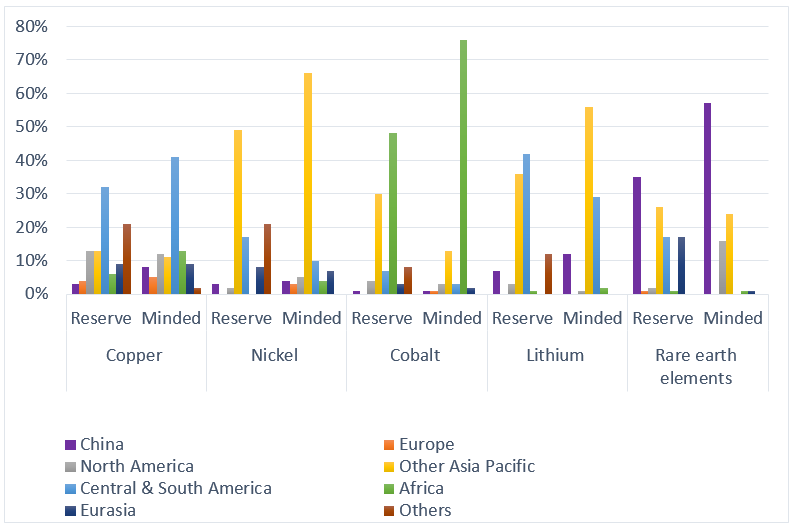
Figure 12 provides an overview of regional mining capacities and material reserves. It highlights the distribution of mining activities across various regions, showing which areas have the largest reserves and the capacity to extract critical materials. The data reveal key global players in resource availability, with some regions holding more significant reserves and mining capabilities than others. Of these, the Asia-Pacific region and Central and South America have the largest shares of mining capacities and reserves.
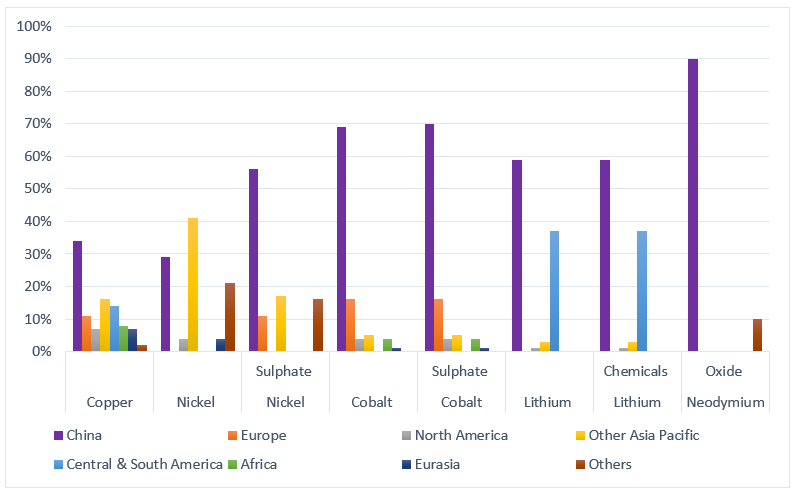
Figure 13 presents an overview of regional production capacities for critical raw materials, illustrating the ability of various regions to supply essential inputs such as copper, lithium and other key resources required across multiple industries. The data clearly highlight China’s dominant position as the leading global producer of many of these critical materials, underscoring its strategic influence within global supply chains.
Source: International Energy Agency, Energy Technology Perspectives 2023 (IEA)[43]
Source: International Energy Agency, Energy Technology Perspectives 2023 (IEA)[44]
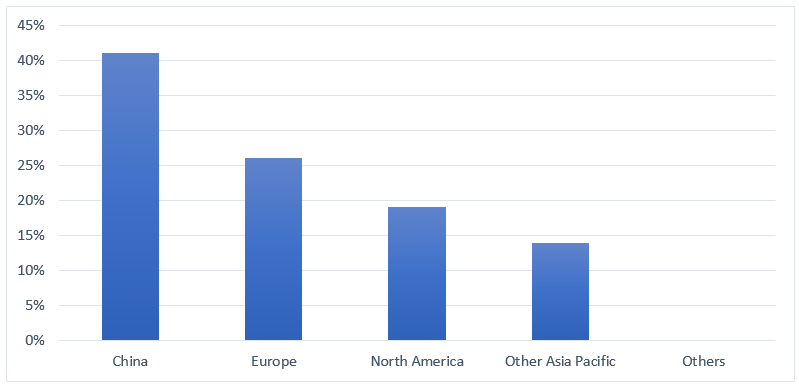
Figure 14 illustrates the distribution of electrolyser production capacity across different regions. China emerges as the dominant global manufacturer, reflecting its strong industrial base and leadership in clean energy technologies. Europe ranks second, driven by substantial investment in green hydrogen and renewable energy infrastructure. North America and the broader Asia-Pacific region also contribute to global electrolyser production, though at a more limited scale. The data underscore China’s pivotal position in the electrolyser market, while highlighting ongoing efforts in Europe and North America to expand domestic manufacturing in response to the growing demand for green hydrogen technologies.
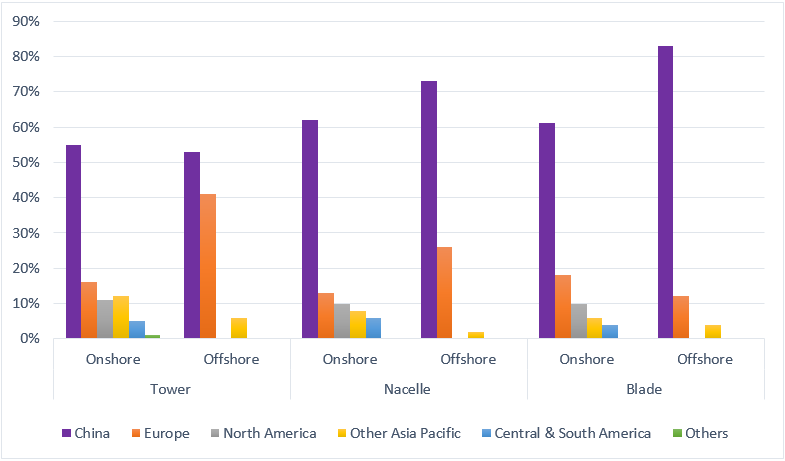
Figure 15 presents a summary of wind turbine component production capacities by country. China clearly leads the global market, holding a commanding share of manufacturing output. Europe and North America maintain substantial production capabilities, but on a comparatively small scale. This highlights China’s prominent role and competitive advantage in the manufacture of wind turbine technology.
Source: International Energy Agency, Energy Technology Perspectives 2023 (IEA)[45]
Source: International Energy Agency, Energy Technology Perspectives 2023 (IEA)[46]
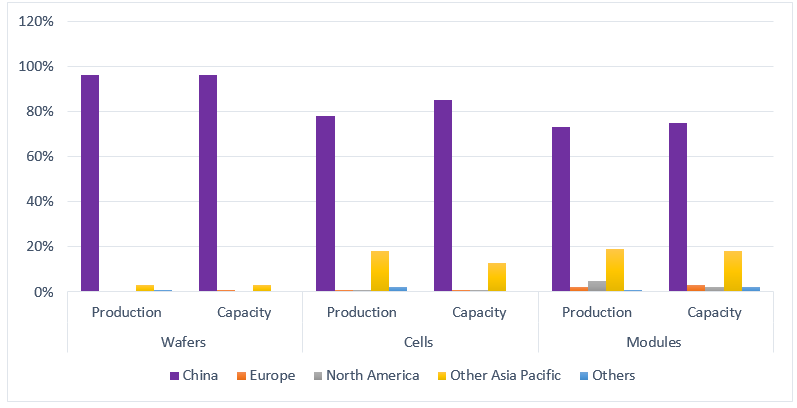
Figure 16 illustrates the production capacities for photovoltaic (PV) components across various countries. China emerges as the clear leader in PV component manufacturing, with other nations exhibiting minimal or negligible production capabilities in comparison.
Source: International Energy Agency, Energy Technology Perspectives 2023 (IEA)[47]
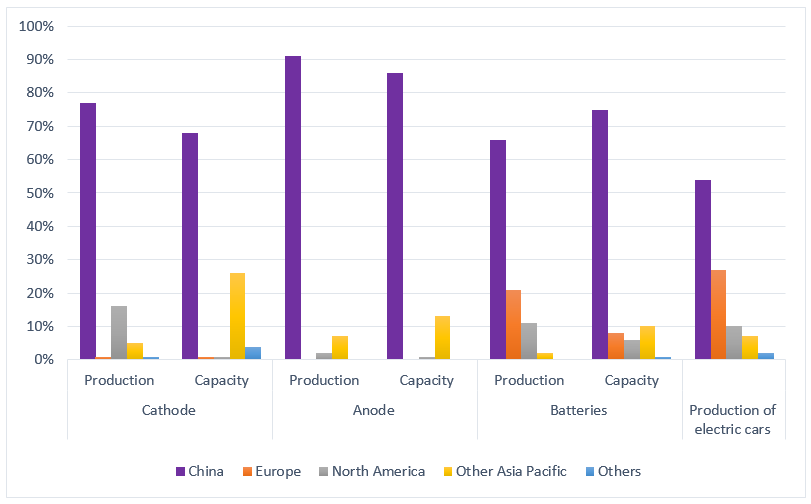
Figure 17 highlights a critical obstacle facing the Department of Defence in securing reliable battery supplies: the overwhelming dominance of China within the global battery supply network. China controls the production of essential materials and components such as anodes and cathodes, as well as precursor substances. Even supply chains based domestically often depend on Chinese-sourced inputs, exposing them to significant vulnerabilities. With the anticipated surge in electrification by 2030, dependence on Chinese battery production is expected to intensify, with China’s leading position projected to persist.[48]
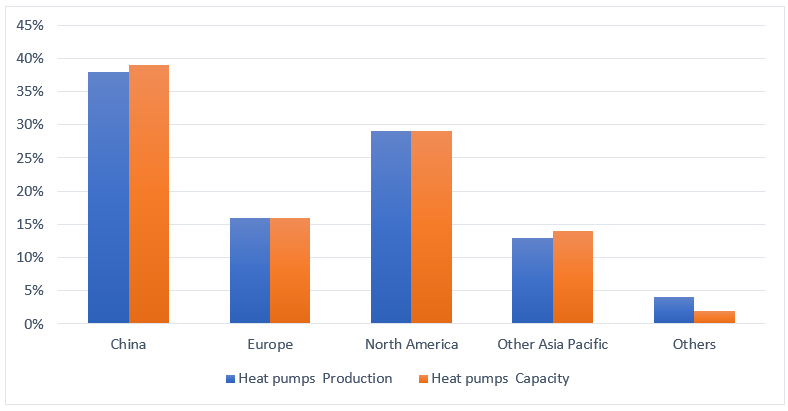
The manufacturing of heat pumps is heavily influenced by regional production capacity and capabilities. Figure 18 illustrates that China holds the largest share of production capacity for heat pump components, with North America and Europe ranking second and third, respectively.
Source: International Energy Agency, Energy Technology Perspectives 2023[49]
Source: International Energy Agency, Energy Technology Perspectives 2023[50]
Regional production capacity and capabilities play a vital role in the manufacture of components for fuel cell heavy-duty trucks. As depicted in Figure 19, China leads in production capacity, supported by its advanced infrastructure and technological expertise.
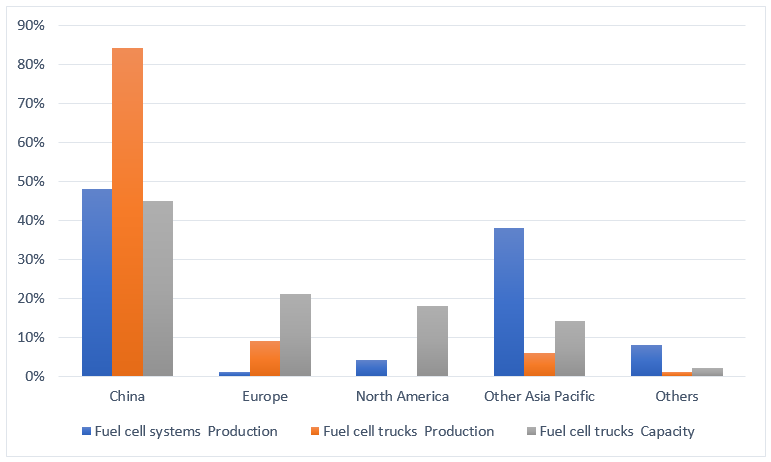
Source: International Energy Agency, Energy Technology Perspectives 2023[51]
Production Lead Times for Mass-Manufacturing Facilities
The transition to mass production of equipment within the energy sector demands considerable lead times, reflecting the complexity of the technologies involved, the challenges of scaling manufacturing processes, and the integration of sophisticated systems. Table 2 details the lead times associated with producing various critical pieces of equipment, covering a broad spectrum of technologies including renewable energy assets such as solar panels and wind turbines, hydrogen electrolysers, and other emerging innovations. By outlining these production timelines, the table offers valuable insight into the scale-up challenges faced in meeting the growing demand for sustainable energy solutions.[52]
|
Technology |
Year |
|
|---|---|---|
| Solar photovoltaic | Polysilicon |
1–3.5 |
| Wafers |
0.5–2 |
|
| Solar cells |
0.5–2 |
|
| Solar modules |
0.5–2 |
|
| Wind turbines | Blade |
1–2 |
| Tower |
1.5–2.5 |
|
| Nacelle |
1.5–2 |
|
| Electrolysers |
2–3 |
|
| Electric vehicles | Anode |
2–5 |
| Cathode |
2–5 |
|
| Battery |
0.5–4.5 |
|
| Heat pumps |
1–3 |
|
| Fuel cell trucks | Fuel cell stacks |
1.5–2.5 |
| Fuel cell trucks |
0.5–1.5 |
|
Australian Defence Fuel Supply Chain Activities
The ongoing global energy transition, coupled with the evolving and increasingly diverse energy needs of the Australian Defence Force (ADF), is set to significantly reshape the structure and operations of the defence fuel supply chain. Traditionally focused on the procurement, storage, handling and distribution of conventional fossil fuels powering ADF vehicles, aircraft, naval vessels and installations, this supply chain must now expand its scope and complexity to incorporate lower-carbon alternatives such as biofuels, synthetic fuels and other renewable energy sources. This multifaceted system involves a wide array of activities, technologies, infrastructure and organisations, all working to ensure that fuel is delivered safely, efficiently and reliably to support mission-critical operations. Effective coordination across procurement channels, storage facilities, transportation networks and real-time fuel management is essential, with oversight and strategic direction provided by the Commander of Joint Logistics, who is responsible for maintaining the supply chain’s safety, efficiency, integration and cost-effectiveness.[54] As the ADF advances toward sustainable energy adoption, the supply chain must adapt to accommodate new fuel types and energy carriers, each with unique handling, storage and distribution requirements. The supply chain framework illustrated in Figure 20. provides a critical blueprint for managing this transition, emphasising pathways and checkpoints that are vital for maintaining operational readiness. Furthermore, integrating emerging energy sources presents challenges related to supply security, logistical complexity and infrastructure adaptation. Successfully addressing these issues will be crucial not only for achieving Australia’s defence sustainability goals but also for preserving the resilience and effectiveness of the ADF’s energy supply under all conditions.
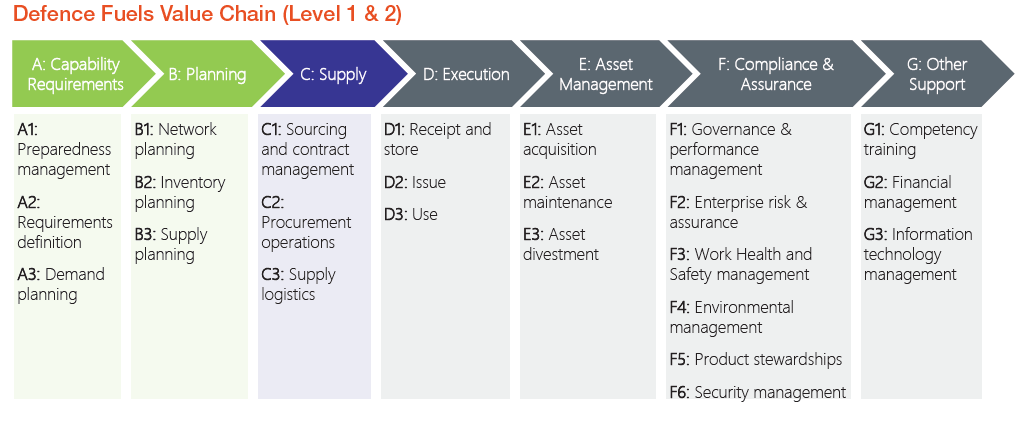
Source: Department of Defence, Future Energy Strategy: August 2023[55]
The Future of Hydrogen Generation and Distribution
This part explores the application of hydrogen prospects worldwide.
Geographical Distribution of Clean Hydrogen Production
Hydrogen generation in different regions by 2050 has been forecasted in Figure 21. As shown, green hydrogen is anticipated to lead the global hydrogen supply, making up 50 to 65 per cent of the total, due to decreasing costs of renewable energy and electrolysers. This production will be centred in regions rich in renewable resources, like Australia and Iberia. However, production might be limited by the availability of renewable energy, requiring substantial investments in electrolysers and large-scale manufacturing capabilities. Blue hydrogen is expected to account for 20 to 35 per cent of the supply, mainly in areas with affordable natural gas and carbon capture infrastructure, such as the Middle East and North America. Producing blue hydrogen will necessitate about 500 billion cubic metres of natural gas and the capacity to capture and store 750 to 1,000 megatonnes of CO2. The regional distribution of blue and green hydrogen production will vary based on local cost factors, with green hydrogen flourishing in renewable-rich areas and blue hydrogen in regions abundant in natural gas. Expanding hydrogen production successfully will depend on overcoming challenges related to renewable energy availability, technological progress and infrastructure development.[56]
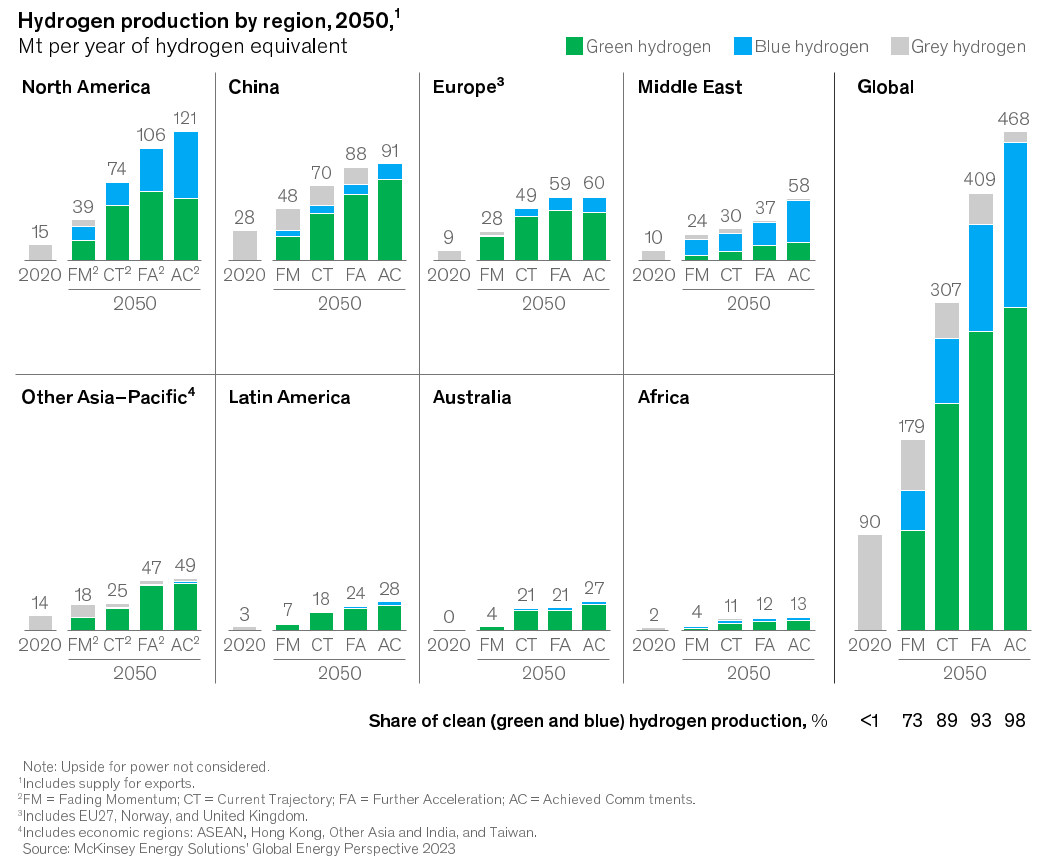
Source: ‘Global Energy Perspective 2023: Hydrogen Outlook’, McKinsey & Company[57]
Global Deployment of Renewable Resources for Hydrogen Generation
The deployment of renewable resources for hydrogen generation across various regions in 2027 is depicted in Figure 22. From this, an estimated 50 gigawatts (GW) of renewable energy capacity will be dedicated to hydrogen production, representing approximately 2 per cent of total renewable capacity growth. Leading this expansion is China, with significant contributions also coming from Australia, Chile and the United States, which together account for around two-thirds of the new capacity. This additional capacity will be evenly distributed globally between solar PV and onshore wind, depending on regional resource availability. China aims to increase its renewable capacity by more than 18 GW by 2027, driven by national decarbonisation goals and local policies. For example, the province of Inner Mongolia, known for its abundant solar and wind resources, aims to produce 500,000 tonnes of renewable hydrogen annually, supported by accessible financing and industrial development. Meanwhile, Europe plans to add 7 GW of renewable capacity for hydrogen production by 2027, motivated by decarbonisation targets and the need to enhance energy security, particularly by reducing dependence on Russian gas. Spain leads this initiative, followed by Germany, Sweden, Denmark and the Netherlands, all pursuing ambitious goals for deploying electrolysis technology, supported by financial incentives such as those provided by the Important Projects of Common European Interest program.[58]
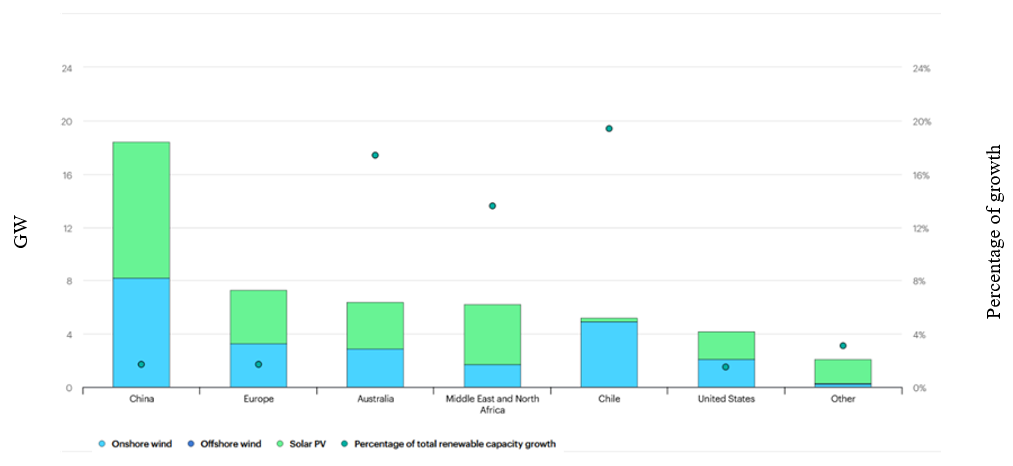
Source: ‘Total Renewable Capacity Dedicated to Hydrogen Production in the Main Case by Region, 2021–2027’, IEA[59]
Worldwide Mapping of Hydrogen Trading
The global hydrogen trade in 2050 is anticipated in Figure 23, driven by strategically located export hubs near abundant renewable energy sources or natural gas reserves, linking with key demand centres in Asia and Europe. Europe aims to meet a substantial part of its hydrogen demand domestically, leveraging regions like Iberia and the Nordic area for their competitive gas prices and robust renewable energy capabilities. Additional supply sources may include the Middle East, North Africa and North America. Conversely, Asia looks to import hydrogen from diverse regions such as Australia, Latin America, the Middle East and North America. Certain regions are expected to emerge as pivotal hydrogen production hubs, benefiting from efficient market access via pipelines or adapted natural gas infrastructure. Europe’s trade routes are likely to heavily rely on pipelines, while international shipping could play a vital role, potentially involving hydrogen conversion into synfuels like ammonia or methanol at export terminals. Liquid hydrogen shipments are anticipated to grow post-2030, potentially reaching around 20 million metric tonnes annually by 2050, reflecting historical growth patterns observed in liquefied natural gas development.[60]
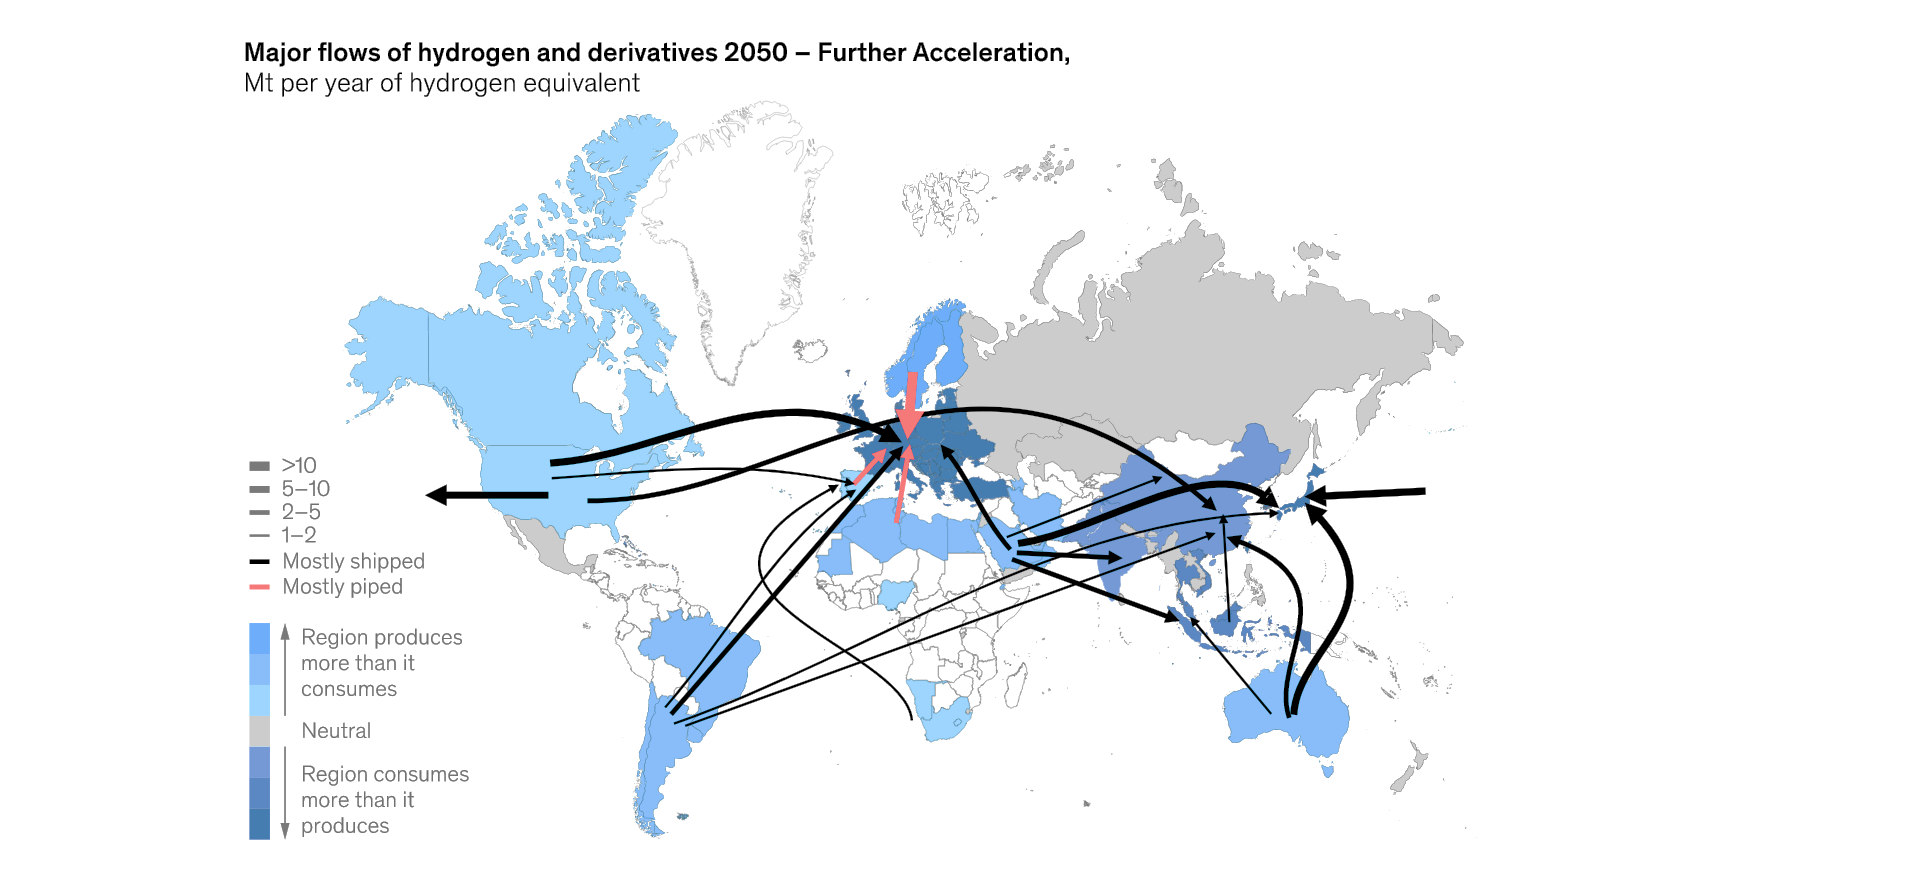
Source: ‘Global Energy Perspective 2023: Hydrogen Outlook’, McKinsey & Company[61]
Methodology for Managing Supply Chain Disruption Risks in Military Microgrids
In this section, we introduce an approach for identifying and managing risks associated with supply chain disruptions in military microgrids, using the proposed energy resilience impact metric. This methodology combines multiple techniques into a unified analysis tool designed to reduce the impact on mission effectiveness. The steps outlined in Figure 24 guide the process, with the option to customise the approach based on local installation protocols.[62]
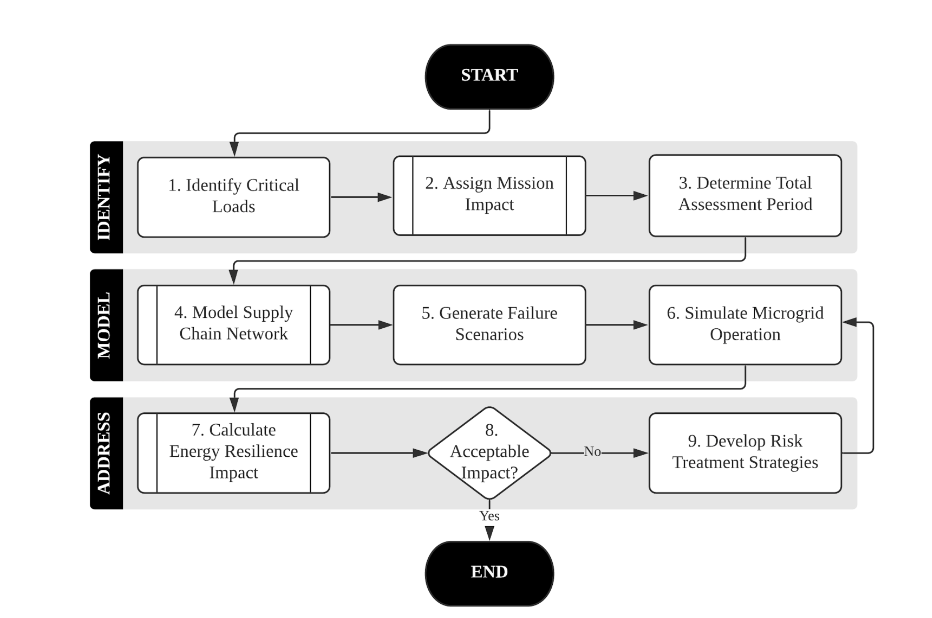
Step 1: Identify Essential Loads
The first task for the installation energy manager (IEM) is to pinpoint the critical loads that are necessary for mission success. This is most effectively achieved by dividing the installation into its individual facilities and determining which ones require uninterrupted power. While further classification at the subsystem or component level is possible, it is typically not needed. We recommend illustrating these facilities in an electrical one-line diagram to create a comprehensive view of the microgrid. This approach will help clarify the problem space and, crucially, define the power flow requirements for future simulations.
Step 2: Assign Mission Impact Ratings
The next step involves assigning a mission impact score to each facility, using a scale from 0 to 100. This is a unitless value that reflects the importance of each facility to the mission’s success. This stage addresses key considerations, such as:
- How long can the facility operate without compromising the mission?
- How much of the mission can continue if a facility becomes non-operational?
- Does the disruption lead to cascading failures across the installation?
- Are there any redundancies, or can functions be transferred to another facility?
These scores should be verified by relevant stakeholders to inform emergency management decisions and guide prioritisation of funding for improvements.
Step 3: Determine the Total Evaluation Period
The IEM must now decide on the total evaluation period (𝑇) for subsequent calculations and simulations. This period should cover the ‘days of autonomy’ required by the relevant armed service, although it can be extended to assess alternative system configurations. If the duration is too long, additional factors such as equipment reliability and maintainability need to be considered. We recommend setting 𝑇 to at least two refuelling cycles or 14 days, whichever is longer. This will provide enough time to observe the impact of supply chain disruptions while complying with the Ministry of Defence policy.
Step 4: Model the Supply Chain Network
The next step involves using a discrete-time Markov chain / dynamic Bayesian network approach to model the energy supply chain network. Starting from the installation and working backwards, the IEM will account for all entities influencing the value stream. Each node in the network will be represented by a discrete-time Markov chain to model operational states, with conditional probability tables added where dependencies exist. Collaborating with logistics specialists is crucial to ensure accurate representation of transitions and probabilities. The analysis should be limited to the short-term sustainability of the islanded microgrid, guided by the defined evaluation period (𝑇). The longer the evaluation period, the greater the likelihood that upstream disruptions will affect the installation.
Step 5: Generate Disruption Scenarios
Once the network model is developed, the IEM must create a set of disruption scenarios that could affect the supply chain. Since there is no universal method for identifying risks, each node’s specific conditions must be considered. Historical data can offer valuable insights, and localised threats (such as weather conditions, waterborne risks or proximity to population centres) and the current geopolitical situation should also be factored in. Suggested scenarios include:
- Baseline scenario: Normal supply chain network operation with no disruptions throughout 𝑇.
- Worst-case scenario: Complete disruption to the energy supply chain network for the entire duration of 𝑇.
- Single-node scenario: Disruption affecting a key node essential to the supply chain network operation.
- Multiple-node scenario: Disruption affecting several nodes simultaneously.
Step 6: Simulate Microgrid Performance
With the failure scenarios in place, the IEM can simulate the operation of the islanded microgrid. Key inputs for the simulation include generator sizing, refuelling schedules, specifications for photovoltaic arrays, energy storage system capacities, and load profiles. The simulation should focus on stress periods, such as peak demand or low sunlight, to reveal potential vulnerabilities. Power-flow analysis will be used to calculate power generation, consumption and unmet demand, with particular attention paid to unmet demand.
Step 7: Assess Energy Resilience Impact
Energy resilience impact can now be calculated for critical loads or the entire microgrid, depending on the scope of the analysis. These calculations treat each load equally, but this may not fully reflect their relative importance. To adjust for this, the most affected critical load sets the baseline energy resilience impact score, which is then modified by the mission impact scores for other loads.
Step 8: Determine Acceptable Impact Levels
At this point, the calculated energy resilience metric is compared to predetermined threshold values. Rather than choosing an arbitrary cut-off, the IEM can use a percentage of the total impact modifier (for example, 5 per cent of the total impact modifier) to define an acceptable level of impact. If the calculated impact falls within acceptable limits, the microgrid is considered sufficiently resilient, and no further action is required. If the impact exceeds the threshold, the IEM proceeds to Step 9 for further analysis.
Step 9: Develop Risk Mitigation Strategies
The IEM reviews the simulation results to identify the primary causes of mission degradation. If multiple issues are identified, the supply chain vulnerabilities should be addressed in order of their impact. Microgrid improvements, such as system configuration changes or updates to operational policies, should be tested through Steps 6 to 8 to reduce the energy resilience impact. Once a satisfactory solution is found, the IEM submits design recommendations to the installation commander for final approval.
Key Recommendations to Enhance Supply Chain Resilience in Australia
As outlined in the previous subsections, Australia’s energy supply chain faces notable vulnerabilities; hence, Table 3 presents several proposed alternatives to strengthen the country’s energy sector supply chain.
| Risk | Description | Suggestion | Effects |
|---|---|---|---|
| High dependency on imported fuels |
|
|
|
| Vulnerable defence energy logistics |
|
|
|
| Lack of domestic processing capabilities |
|
|
|
| Centralised and exposed power infrastructure |
|
|
|
| Inconsistent use of resilient technologies |
|
|
|
| Over-reliance on global technology supply chains |
|
|
|
| External processing of critical minerals |
|
|
|
Conclusion
Secure and resilient supply chains are essential for maintaining national defence readiness and supporting the transition to sustainable energy systems. The defence sector depends on complex global supply networks that are increasingly vulnerable to geopolitical and operational risks. Addressing these vulnerabilities requires a proactive approach that includes identifying critical dependencies, enhancing regional production capabilities and adopting robust risk management methodologies. In the energy sector, similar challenges exist, particularly in the sourcing of raw materials, skilled labour and technological infrastructure. The transition to clean energy, including the development of a global hydrogen economy, adds new layers of complexity that must be addressed through coordinated policy, investment and innovation. Strengthening the capacity to manage disruptions, especially in sensitive areas such as military microgrids, is crucial for ensuring continuity of operations.
Endnotes
[1] AM Zhivov, M Case, R Liesen, J Kimman and W Broers, ‘Energy Master Planning Towards Net-Zero Energy Communities/Campuses’, ASHRAE Transactions 120, no. 1 (2014) at: https://apps.dtic.mil/sti/tr/pdf/AD1049051.pdf.
[2] The Role of Renewable Energy in National Security (American Council on Renewable Energy, 2018) at: https://acore.org/wp-content/uploads/2018/10/ACORE_Issue-Brief_-The-Role-of-Renewable-Energy-in-National-Security.pdf.
[3] William W Anderson, ‘Resilience Assessment of Islanded Renewable Energy Microgrids’, dissertation, Naval Postgraduate School, Monterey CA, 2020, at: https://apps.dtic.mil/sti/pdfs/AD1126753.pdf.
[4] Ruth Fish, ‘Design and Modeling of Hybrid Microgrids in Arctic Environments’, thesis, Naval Postgraduate School, Monterey CA, 2020, at: https://apps.dtic.mil/sti/pdfs/AD1126429.pdf.
[5] Caolionn O’Connell, Unraveling the Gordian Knot: Considering Supply Chain Resiliency (Santa Monica CA: RAND Corporation, 2021), at: https://apps.dtic.mil/sti/trecms/pdf/AD1150228.pdf.
[6] B Martin, LH Baldwin, P Deluca, N Henriquez Sanchez, M Hvizda, CD Smith and NP Whitehead, Supply Chain Interdependence and Geopolitical Vulnerability: The Case of Taiwan and High-End Semiconductors (Santa Monica CA: RAND Corporation, 2023), at: https://apps.dtic.mil/sti/trecms/pdf/AD1195673.pdf.
[7] Jessica P Klein, ‘Depending on China for Rare Earth Elements: An Acceptable Strategic Vulnerability for the United States?’, master’s thesis, U.S. Army Command and General Staff College, Fort Leavenworth KS, 2020, at: https://apps.dtic.mil/sti/trecms/pdf/AD1158542.pdf.
[8] JR Dominy, SA Arnold, FR Frank, JR Holzer and JN Richman, Exploratory Analysis of Supply Chains in the Defense Industrial Base (Alexandria VA: Institute for Defense Analyses, 2022), at: https://apps.dtic.mil/sti/tr/pdf/ADA560124.pdf.
[9] Department of Defense, Securing Defense-Critical Supply Chains: An Action Plan Developed in Response to President Biden’s Executive Order 14017 (US Department of Defense, 2022), at: https://apps.dtic.mil/sti/pdfs/AD1163223.pdf.
[10] R Baldwin, Global Supply Chains: Why They Emerged, Why They Matter, and Where They Are Going (Hong Kong: Fung Global Institute, 2012), at: https://www.asiaglobalinstitute.hku.hk/storage/app/media/pdf/richard-baldwin.pdf.
[11] Defence Supply Chain in Australia: Using Industry Insights to Strengthen Our Resilience (Ernst & Young, 2025), at: https://www.ey.com/content/dam/ey-unified-site/ey-com/aus-nzl/documents/pdfs/sovereign-supply-chain-and-defence-report.pdf .
[12] Securing Australia’s Defence Supply Chains (Ai Group Defence Council, Perth USAsia Centre, 2022), at: https://www.aigroup.com.au/globalassets/news/reports/2022/defence-supply-chain-report-280822.pdf.
[13] Ibid.
[14] Ibid.
[15] Ibid.
[16] Ibid.
[17] Ibid.
[18] Ibid.
[19] W Mohammad, A Elomri and L Kerbache, ‘The Global Semiconductor Chip Shortage: Causes, Implications, and Potential Remedies’, IFAC-PapersOnLine 55, no. 10 (2022): 476–483.
[20] NK Tran, H Haralambides, T Notteboom and K Cullinane, ‘The Costs of Maritime Supply Chain Disruptions: The Case of the Suez Canal Blockage by the “Ever Given” Megaship’, International Journal of Production Economics 279 (2025): 109464.
[21] L Jin, J Chen, Z Chen, X Sun and B Yu, ‘Impact of COVID-19 on China’s International Liner Shipping Network Based on AIS Data’, Transport Policy 121 (2022): 90–99.
[22] Aditya Sehgal, ‘Geopolitics of Semiconductor Supply Chains: The Case of TSMC, US-China-Taiwan Relations, and the COVID-19 Crisis’, Independent Study Project (ISP) Collection 3592, SIT Graduate Institute/SIT Study Abroad, 2023, at: https://digitalcollections.sit.edu/cgi/viewcontent.cgi?article=4616&context=isp_collection.
[23] S Orazgaliyev, ‘State Intervention in Kazakhstan’s Energy Sector: Nationalisation or Participation?’, Journal of Eurasian Studies 9, no. 2 (2028): 143–151.
[24] Securing Australia’s Defence Supply Chains.
[25] Ibid.
[26] Ibid.
[27] Department of Defence, 2020 Defence Strategic Update (Commonwealth of Australia, 2020), at: https://www.defence.gov.au/sites/default/files/2020-11/2020_Defence_Strategic_Update.pdf.
[28] Securing Australia’s Defence Supply Chains.
[29] Ibid.
[30] Ibid.
[31] Ibid.
[32] Ibid.
[33] Ibid.
[34] International Energy Agency, Energy Technology Perspectives 2023 (IEA), at: https://iea.blob.core.windows.net/assets/a86b480e-2b03-4e25-bae1-da1395e0b620/EnergyTechnologyPerspectives2023.pdf.
[35] Ibid.
[36] Ibid.
[37] Ibid.
[38] Ibid.
[39] Ibid.
[40] Ibid.
[41] Ibid.
[42] Ibid.
[43] Ibid.
[44] Ibid.
[45] Ibid.
[46] Ibid.
[47] Ibid.
[48] Department of Defense, Securing Defense-Critical Supply Chains.
[49] International Energy Agency, Energy Technology Perspectives 2023.
[50] Ibid.
[51] Ibid.
[52] Ibid.
[53] Ibid.
[54] Department of Defence, Future Energy Strategy: August 2023 (Commonwealth of Australia, 2024), at: https://www.defence.gov.au/sites/default/files/2024-04/Defence-Future-Energy-Strategy.pdf.
[55] Ibid.
[56] ‘Global Energy Perspective 2023: Hydrogen Outlook’, McKinsey & Company (website), 10 January 2024, at: https://www.mckinsey.com/industries/oil-and-gas/our-insights/global-energy-perspective-2023-hydrogen-outlook.
[57] Ibid.
[58] ‘Total Renewable Capacity Dedicated to Hydrogen Production in the Main Case by Region, 2021–2027’, IEA (website), 6 December 2022, at: https://www.iea.org/data-and-statistics/charts/total-renewable-capacity-dedicated-to-hydrogen-production-in-the-main-case-by-region-2021-2027.
[59] Ibid.
[60] ‘Global Energy Perspective 2023: Hydrogen Outlook’.
[61] Ibid.
[62] Edward A Anuat, ‘Energy Resilience Impact of Supply Chain Network Disruption to Military Microgrids’, thesis, Naval Postgraduate School, Monterey CA, 2021, at: https://apps.dtic.mil/sti/trecms/pdf/AD1164802.pdf.